
Bulk Analyze
Learn how to bulk upload a list of defanged indicators and extract information from the results.
Bulk Analyze lets you check multiple indicators simultaneously: perfect for triaging large IP or domain lists, assessing suspicious infrastructure, or analyzing indicators from alerts, logs, and threat feeds.
The New Bulk Experience is in Beta ModeWe are actively soliciting feedback from enterprise customers for the new Bulk Analysis experience. The new experience introduces a more complex workflow with additional data sources.
Prerequisites
You need:
- A Validin Enterprise account (the new experience will be released to Professional Tier Individual accounts soon)
- A list of indicators (domains, IPs, hashes) in defanged or raw format
Limits and costA single bulk search accepts up to 100 indicators (Community) or 1,000 indicators (Enterprise). Each indicator searched costs 3 API queries, drawn from your daily/monthly quota. Community accounts can't start a search that would exceed their remaining quota.
Run a bulk search
- In the Validin dashboard, click Bulk Analyze.
- Add your indicators, separated by spaces. Press enter for new lines.
Defanged indicatorsDefanged indicators have malicious characters replaced with safe alternatives (e.g.,
hxxp://instead ofhttp://). Validin automatically parses defanged indicators from your input, including from complete threat reports.
- Select Next to review extracted indicators.
Review and configure
Extracted indicators appear in a tabulated view with Indicator and Type columns, plus a per‑indicator data source selector.
- Select an indicator to open a slide-out panel containing additional information, including:
- Reputation
- Usage
- Geolocation
- Click any available link to pivot across other sources of information.
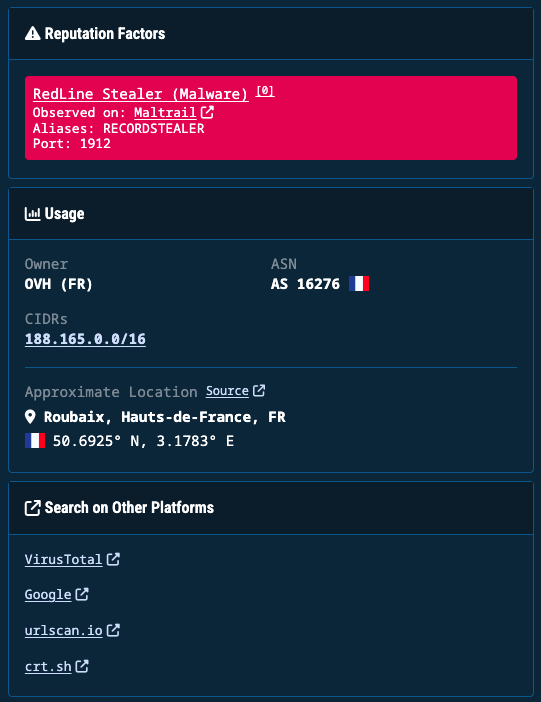
Slide-out panel for a malicious IP address
- Edit an indicator with the pencil icon, or remove one with the trash icon (it's crossed out first, then confirm to delete). Use Add Another or Add Bulk to add more.
- Choose which data sources to run for each indicator: Resolutions, Extra DNS, Host Responses, and Registration. Toggle a whole column from its header checkbox, or use Select all / Clear all.
- (Optional) Under Search Criteria, set a date range with First seen after and Last seen before.
- The Summary shows counts by type and the cost to run (total API queries) before you commit.
Run the search
- Select Run Search.
- Give the search a name and optional description, and optionally enable Email me when the search completes.
- Confirm to start. You're taken to the job page.
Track and view results
- The job page shows a status badge (Queued / Running / Complete / Killed), a progress bar with indicators completed and API queries used, and a Kill button to stop a running search.
- Results are organized into tabs: Indicators, Resolutions, DNS Records, Host Connections, Host Responses, and Registration.
- Select a Host Connection row to open a slide-out with the host responses behind it.
- Use the icons on top of a results table to:
- Export rows as a CSV
- Add selected indicators to an existing or new Project
- Find all your past searches under Bulk Jobs.
Updated 4 months ago