Projects dashboard
Projects in Validin are collaborative workspaces used to group, analyze and track indicators related to a specific investigation, incident, or intelligence requirement.
Page layout and navigation
The Project page is accessible from the left menu, and is divided into two primary areas:
- A main dashboard featuring tabbed content for different data types, with filtering and sorting.
- A slide-out sidebar on the right with indicator summary metrics.
Indicators tab
Displays all indicators added to the Project:
| Column | Description |
|---|---|
| Key | Indicator value such as a domain, IP address, or string |
| Type | Indicator family (for example, dom for domain) |
| Added By | User or external source attribution |
| Added | Timestamp when the indicator was added |
| Tags | Classification or workflow labels |
| Note | Analyst comments or context |
| Track Changes | Toggle to monitor reputation and telemetry changes |
Click around an indicator to open the indicator slideout, or left click a hyperlinked indicator to execute a Core Search.
Use Add Indicators to manually enter or bulk import indicators into the project.
YARA Rules tab
Displays YARA rules associated with the project. Rules may be monitored for detections against observed infrastructure.
| Column | Description |
|---|---|
| Rule | Name of the YARA rule and contributor |
| Activity | Visualization of recent matches |
| First Seen Today | Whether the rule matched new hosts today |
| Actions | Edit or remove the rule |
Rules that are actively monitored display a Tracking vX badge.
Use Add Rule to link new detection rules to the project.
Alerts tab
Lists alert events generated from tracked indicators or YARA rule matches.
What is an alert?Alerts are created when tracked attributes change based on new intelligence received into the platform.
Selecting an alert opens Core Search to investigate the newly observed behavior or infrastructure.
Use Export to download alerts for SOC and CTI workflows as a JSON or CSV.
Scans tab
Lists hosts scanned within the Project.
Scan results help identify reachable services and infrastructure attributes.
| Column | Description |
|---|---|
| Host | Domain or IP address, including port and path |
| Added By | Attribution for who initiated the scan |
| Time | When the scan occurred |
| Options | Scan configuration such as user-agent |
| Countries | Hosting region identified during scanning |
Use Start Scan to run scans on selected indicators.
Exporting scansScan results can also be exported for offline review.
References tab
Shows external intelligence linked to the Project:
| Column | Description |
|---|---|
| Reference | Source (such as a URL or report) |
| Note | Analyst note linked to the reference |
| Added By | User attribution |
| Date Added | Timestamp of when the reference was included |
Use Add Reference to store supporting reports, OSINT, or investigation context.
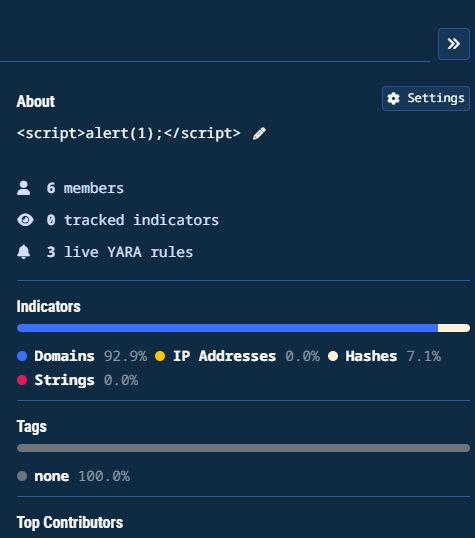
Sidebar panel
Click the two arrows to expand the sidebar menu and display additional context, including:
- Additional information
- Number of organizational members
- Count of tracked indicators
- Count of live YARA rules attached to the Project
The Indicators breakdown chart shows the mix of indicator types.
The Tags section displays classification usage.
Top Contributors lists users who have added the most indicators.
Projects sidebar menu
Project settings
Project settings are used to maintain access preferences, annotation visibility, and alert behavior across investigations.
Select Settings in the context panel to update project configuration.
- My Preferences tab includes:
- Project Notifications: Subscribe to notifications and emails when tracked searches change
- Project Annotations: Show annotations for this project on searches and configure the annotation display color
- Alert Settings tab allows you to enable or disable Automatically Track Changes for newly added IOCs.
Collaboration and tracking
At the top of the page:
- Change Log shows a history of modifications within the Project
- Share controls access to the Project amongst team members
Exporting data
The Export control in each tab allows downloading project data for:
- SIEM and SOAR ingestion
- Threat-hunting and enrichment workflows
- IR case documentation
Tags and notes ensure collaborative continuity during handoffs.
Tips
- Create separate projects for unrelated investigations
- Apply Tags consistently to maintain internal data standards
- Monitor high-impact indicators using Track Changes
- Review References to retain threat context
Updated 7 months ago