Working with Threat Profiles
Threat Profiles in Validin provide a consolidated view of the infrastructure, behavior, and associated intelligence linked to a threat actor or malware family.
Profile structure
Threat Profile content is presented in a tabulated format and organized across multiple tabs. Each tab provides structured data that supports fast filtering, sorting, and pivot-based investigation.
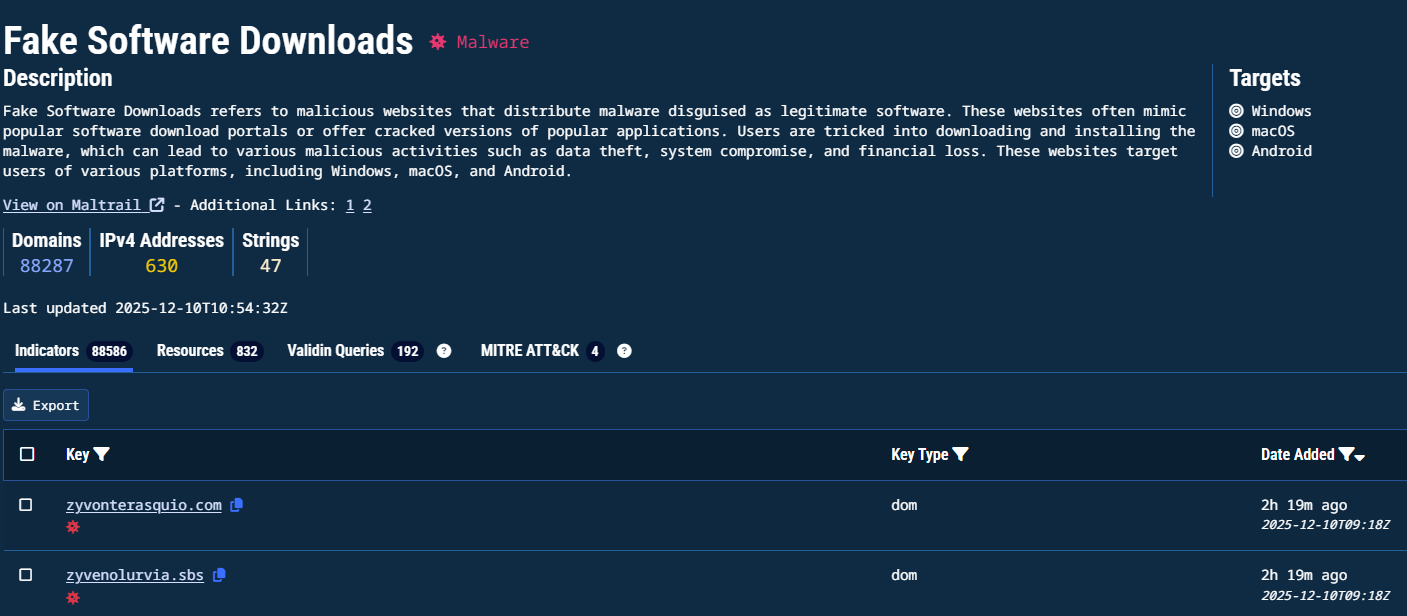
Threat Profile main screen
Profile header
The profile header includes:
- Name and classification (Threat Actor or malware family)
- Description of activity and capabilities
- Targeted platforms (example: Windows, macOS, Android)
- Totals for Domains, IPv4 addresses, and Strings
- Last updated timestamp
- External OSINT reference links when available
Indicators tab
Displays all indicators attributed to the Threat Profile.
Columns include:
- Key: Indicator value such as domain, IP, or string
- Key Type: Indicator family (example:
domfor domain) - Date added: When Validin first recorded the association
Resources tab
Lists public reporting that contributed to the profile. Each entry includes:
- Reference name
- Date added
- A link to the original OSINT source
Validin Queries tab
Provides curated investigation queries available in the platform, validated by public research and threat blogs.
These queries:
- Demonstrate recommended pivot workflows
- Help trace supporting indicators during an investigation
- Link to research publications when relevant
MITRE ATT&CK tab
Displays known threat behaviors mapped to ATT&CK techniques.
Each entry includes:
- Tactic
- Technique name and ID
- A link to MITRE documentation
Use this to align threat behavior with operational risk.
Gathering additional intelligence
- Clicking around an indicator opens a slide-out with additional information available, depending on the indicator.
- Clicking directly on an indicator executes a Core Search
1. Expand an indicator
Click on a row in the results table to display a slideout panel showing:
- Reputation factors (e.g. Malicious classification, and where the indicator has been classified)
- Usage (e..g., domain-to-FQDN relationships)
- Other Informational properties
- Quick links to external scanners:
- VirusTotal
- urlscan.io
- crt.sh
2. Run a Core Search
Select the indicator text (e.g., a domain name) to execute a Core Search on your chosen indicator to gather:
- DNS resolution history
- WHOIS / registrar metadata
- HTTP crawler signatures and infrastructure
- Pivot opportunities into related indicators
Core SearchCore Search queries provide teams with a complete launch point for threat investigations.
Infrastructure attribution
The profile displays summaries of infrastructure used by the threat:
- Domains: observed command-and-control or distribution hosts
- IPv4 addresses: historical DNS resolutions
- Strings: extracted signatures or identifiers (for example dropped filenames)
Intelligence refresh cadenceCounts update dynamically as new evidence is gathered.
Operational tracking
The Last updated timestamp shows the latest intelligence change, including:
- New indicators added to the actor
- Updates to external reference sources
- Refinements to attribution or behavior classification
Export and enrichment
Use the Export control (above the Indicators table) to download IOCs as a JSON or CSV for:
- Security stack ingestion (SIEM, SOAR, EDR, firewall)
- Offline malware analysis workflows
Updated 7 months ago