Navigating the Dashboard
Learn how to navigate the Validin Dashboard.
The Dashboard is the first page you see after logging into Validin.
It provides a consolidated overview of your recent activity, current query usage, and the latest threat indicators observed across the platform.
Dashboard overview
The dashboard consists of three primary components:
- Navigation Menu
- Search and History Panel
- Latest Threat Indicators Feed
Navigation menu
The left-hand menu provides access to all major areas of the platform.
| Navigation Item | Description |
|---|---|
| Dashboard | Returns you to the home view at any time. |
| Search | Run direct lookups against domains, IPs, URLs, certificates, titles, GTAGs, or other supported pivots. |
| Advanced Search | Execute syntax-based queries for deep analysis. |
| Bulk Analyze | Upload and process large batches of indicators. |
| Lookalikes | Identify brand impersonation domains. |
| Projects | Access collaborative project spaces for investigations, monitoring, and indicator management. |
| Threat Profiles | View curated threat actor, malware, and campaign intelligence data. |
| Upgrade | View available tiers and upgrade options. |
Subscription levelsAvailable navigation items are dictated by your current subscription level. For a full breakdown, visit the Pricing page.
Search panel
At the centre of the dashboard is the global search bar. This field accepts any supported pivot, including:
- Domains or subdomains
- IP addresses or CIDRs
- URLs or HTTP paths
- GTAGs
- Certificates or hashes
- Titles and keyword expressions
Enter a value and select Search to execute a search.
Query usage summary
Above the search bar, you'll see:
- Queries today
- Queries this month
These counters help you track consumption alongside your allocated query limit.
Recent search history
Your last performed searches appear below the search bar. This history provides quick access to frequently used pivots or recent investigative work.
Columns include:
| Field | Description |
|---|---|
| Search Key | The domain, IP, title, or pivot used. |
| Time | When the search was executed. |
Selecting a value immediately re-runs the search.
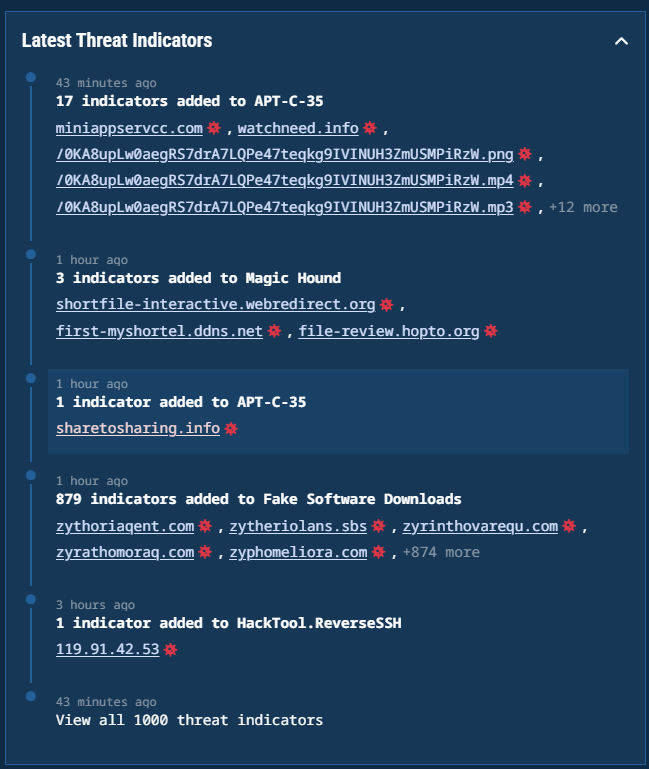
Latest Threat Indicators feed
The right-hand panel displays the most recent indicators automatically ingested and classified in the Threat Profiles menu:
For each event, the feed shows:
- The number of indicators added
- The associated threat grouping or actor where applicable
- A small preview of the observed indicators
- The time of ingestion
Selecting View all threat indicators opens the full indicator stream in Threat Profiles for deeper exploration.
Latest threat indicators
Updated 7 months ago