Timeline view
Learn how to view data, including configuration changes, over a set period of time.
Timeline view presents Validin data as a continuous sequence of observations over time.
Instead of reviewing infrastructure as a static list of records, analysts can see how domains, IP addresses, and related artifacts appear, persist, and change across defined periods.
How to switch to Timeline view
Timeline view is available in most screens where a results table is displayed.
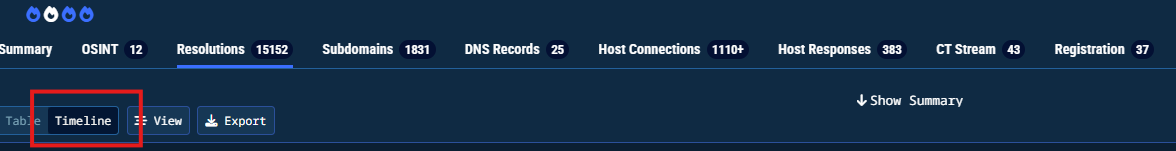
At the top of the results area, use the Table / Timeline toggle to switch between views.
- Select Timeline to immediately re-render the current dataset as a time-based visualization, using the same filters, sorting, and scope already applied in table view.
- Switch back to Table to return the data to its original tabular format without resetting the query or filters.
What timeline view represents
Each row in timeline view corresponds to a specific observed value, such as a DNS record value, IP address, nameserver, host response artifact, registration attribute, or OSINT reference.
The horizontal axis represents time, bounded by the first and most recent observation of that value.
By placing multiple values on the same timeline, analysts can assess whether infrastructure elements were active at the same time, rotated frequently, or remained stable for extended periods.
NoteTimeline view reflects observed presence over time. It does not automatically infer intent or apply scoring.
Timeline view across data types
DNS and resolution data
For DNS-related data, timeline view shows when specific DNS record values were observed for a domain over time.
This includes forward resolution targets such as IP addresses and nameservers, as well as other DNS record types including CNAMEs, SOA records, delegated nameservers, and additional authoritative values.
Timeline view allows analysts to see how a domain’s DNS configuration evolves, not just where it resolves at a single point in time. Changes to delegation, canonical name chains, or zone authority metadata become visible as distinct periods of activity.
Overlapping timelines help identify periods where multiple DNS values coexisted, such as parallel resolution paths, transitional CNAMEs, or overlapping delegation during infrastructure changes.
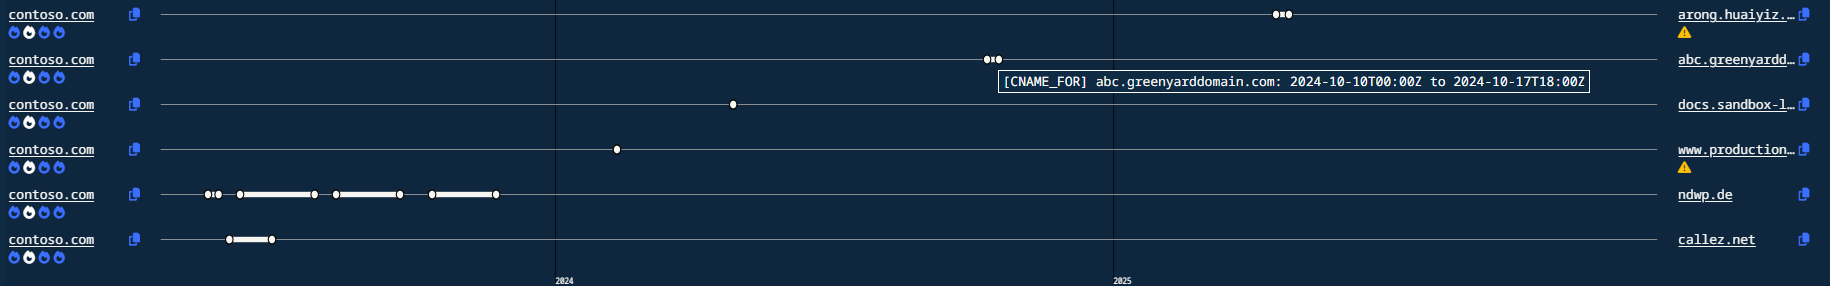
Timeline view of DNS resolutions.
Host connections
In Host Connections, timeline view illustrates when relationships between domains, IPs, and related hosts were observed.
Analysts use this view to understand when connections were established, how long they persisted, and whether relationships were short-lived or stable. This is commonly used to review shared hosting, infrastructure reuse, or transitional connections during hosting changes.
Host responses
For Host Responses, timeline view highlights when specific response behaviors were observed.
Response status codes, redirect behavior, content fingerprints, and other response artifacts appear as time-bounded observations.
Registration data
Timeline view for registration data shows how registration-related attributes change over time.
This includes registrar associations, nameserver configurations tied to registration records, and recorded events such as updates, renewals, or expiration-related changes.
OSINT and external references
For OSINT data, timeline view shows when external sources referenced a domain or IP address.
These timelines provide context around when activity was publicly documented relative to observed infrastructure behavior.
Analysts often compare OSINT timelines with internal observations to understand reporting lag or confirmation timing.
Interpreting timeline patterns
Long, uninterrupted timeline bars indicate sustained presence, while fragmented or clustered markers suggest intermittent or rotating activity.
Timelines that extend to the present represent values that remain active, while timelines that end earlier represent historical associations.
Selecting individual timeline entries opens additional details, including precise timestamps and supporting context, allowing analysts to move from high-level patterns to specific evidence.
Using timeline view and table view together
Timeline view is designed to complement table view rather than replace it.
Table view is typically used for filtering, sorting, and exporting data. Timeline view is used to understand how that data behaves over time.
Analysts commonly switch between the two during investigations, using timeline view to identify periods of interest and table view to examine individual records in detail.
Updated 7 months ago